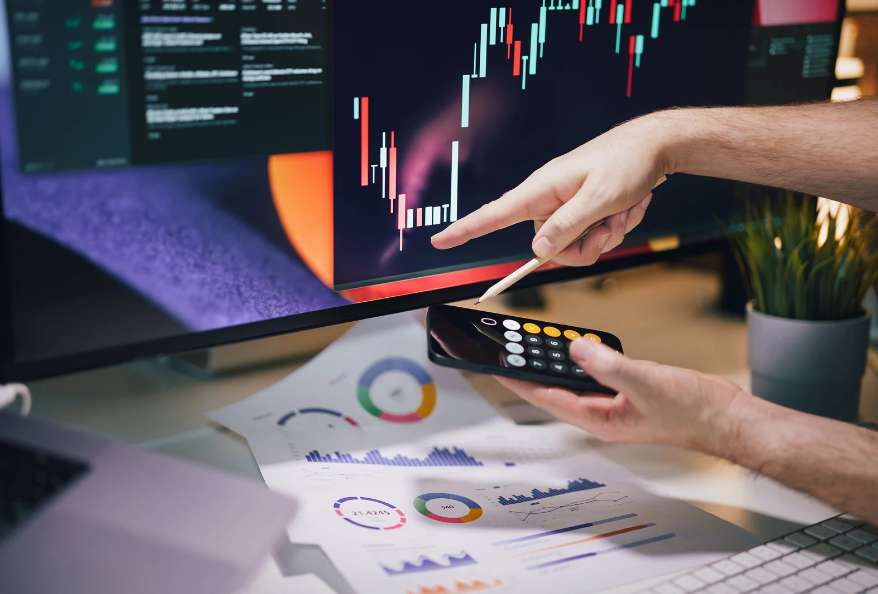
Every trader has had an idea that looked brilliant on a chart and then fell apart with real money. Backtesting exists to catch that early.
By running a strategy against past market data, you can see how it might have behaved before you put a dollar at risk.
Here is how the software works, what to check in the data, and where AI fits in.
What Backtesting Software Actually Does
Backtesting software is a tool that will apply a set of trading rules to historical price data. You can set your rules for when you want to enter, exit, and put a stop on a trade. The software will then simulate the trades using historical prices and show you how many times you would have won/lost and the drawdown.
The quality of what you get out of this will obviously depend on the rules you set and the data. Some platforms, such as trade ideas, include a backtester but also allow you to scan in real time. This is useful, but you should still ensure you are looking at the results yourself.
Weak data produces confident, wrong answers. Check how many years it covers, which instruments it includes, and whether it handles extended hours. Two biases deserve special attention.
Bias
What goes wrong
Usual fix
Look-ahead bias
The test uses information that was not available at the time of the trade, such as restated financials.
Point-in-time data
Survivorship bias
The dataset only includes companies that still exist, so failed and acquired names vanish and results look better than they were.
Include delisted companies in the sample
Where AI Stock Trading Software Fits
AI stock trading software mostly helps with spotting patterns and generating signals. It does not remove uncertainty. Many AI trading platforms now ship signals next to their scanners, yet a signal from a model is still just a rule you can question and test.
Using AI for stock trading works best when you treat each output as a hypothesis. Run it through the same backtest you would apply to a strategy you wrote yourself.
Rule definition: Can you describe a strategy in plain terms, or do you need to code it?
Data depth: How far back does it go, and what does the data cost?
Trade visibility: Can you review each simulated trade, not just summary numbers?
Live comparison: Can you compare backtest results with real trading results?
Total cost: Include data fees and add-ons, not only the subscription.
Test Out of Sample
Overfitting refers to strategies that have been so heavily tuned that they perform very well in historical back-tests, but have no performance in live data.
A study of US ETFs that were launched between 1993 and 2014 showed that strategies had an average annual excess return of 5%; however, once launched, their performance dropped to 0%.
To avoid this, strategies should be built using one time period and tested on completely separate data. Walk-forward is where this is repeated across different time periods.
The SEC notes that back-tested performance is hypothetical and does not reflect actual performance, and that past results cannot predict how a strategy will perform in the future. Its investor bulletin on performance claims is a useful read before you trust any impressive-looking equity curve.
A sensible habit is to paper trade a strategy for a few weeks after it passes testing, then compare the live-style results with the backtest. Gaps between the two usually point to costs, slippage, or rules that were too tuned to the past.
FAQs: Stock Strategy Backtesting Software
1. What is the best backtesting software?
It depends on what historical data you have available, how easy the software is to use, what level of detail you get down to the trade level, and the cost. You can try a free trial.
2. Do I need any coding knowledge?
It depends on what software you use. Some are very easy to use with simple rules. Others will need some coding.
3. How many years of historical data do I need for my stock strategy?
Use enough data to ensure that your strategy can be tested in an up, down, and sideways market. You should also ensure it covers high-volatility periods.
Sneha More is an Information Technology specialist, data analyst, and technology writer with a strong focus on data science, big data frameworks, and modern web technologies. Guided by a philosophy of continuous, hands-on learning, she explores how distributed systems and analytical models can be leveraged to extract meaningful insights from massive datasets.
With practical experience in data analytics, dataset manipulation, and statistical modeling, Sneha examines the intersection of machine learning, big data infrastructure, and practical software engineering. She is particularly interested in how emerging data architectures can drive informed decision-making and solve real-world technical challenges.