Learn how to improve inventory accuracy with clean SKUs, documented stock movements, cycle counts, reorder points, and a 30-day action plan for small teams.
Accurate inventory records help small businesses make better purchasing, sales, service, and cash-flow decisions. When the quantity shown in a system matches the quantity actually available for sale, use, or shipment, teams stop promising stock they cannot deliver and stop buying inventory they do not need. That single point of agreement affects customer service, purchasing, accounting, production planning, and working capital. You can improve inventory accuracy without a large warehouse or a complex technology project. It starts with clean product records, consistent rules for every stock movement, and a routine for comparing physical counts with recorded quantities. This guide explains where errors come from, how to fix the processes behind them, and how to hold the gains with a 30-day action plan.
Inventory accuracy is the difference between recorded stock and physical stock. If a business believes it has 100 units but only 82 are available after unrecorded returns, damaged goods, and completed orders, it may accept orders it cannot fulfill or buy inventory it does not need. Research suggests this is the norm rather than the exception. A study of nearly 370,000 inventory records across 37 stores of one retailer found that 65% of records were inaccurate, with the average error equal to roughly 35% of the stock actually on the shelf (DeHoratius and Raman, Management Science, 2008).
These errors affect customer service, purchasing, accounting, production planning, and working capital. Inventory control is therefore a business-wide responsibility, not only a warehouse task. The cost is measurable. A field experiment by ECR Retail Loss found that correcting inaccurate stock records produced sales increases of roughly 4% to 8% across participating retailers.
Common Causes Of Inventory Errors
Common problems include manual entry mistakes, duplicate SKUs, late receiving updates, misplaced products, unrecorded damage, and returns put back into stock without inspection. Disconnected sales channels and informal transfers between stores, vehicles, or job sites can also create misleading totals. When a negative balance appears, do not simply correct it. Trace the issue back to receiving, storage, picking, shipping, returns, or adjustments to identify where the process failed.
How To Clean Product Data
Build One Reliable Product Record
Assign a unique SKU to each stocked product and its variations. Use consistent names, units of measure, sizes, colors, costs, selling prices, supplier details, and storage locations. Keep services, delivery fees, and non-stock items separate from physical inventory. Before deleting inactive or duplicate records, review their transaction history so prior sales and purchasing data remains understandable.
Run A Product-Data Audit
Export the product list and review duplicate names, unclear codes, missing costs, incorrect units, and products without a location. Start with high-value, fast-moving, or frequently adjusted items. Clean records also make segmentation more useful. Recent study on inventory segmentation illustrates why structured demand and product data matter when businesses later introduce more sophisticated forecasting methods.
How To Standardize Stock Movements
Every unit should have a documented path through the business: receive it, inspect it, record accepted quantities, store it in an assigned location, confirm it during picking, and record the final shipped quantity. Damage, losses, found stock, and count differences should be recorded as adjustments with a reason. Written rules for receiving, returns, transfers, and adjustments do not need to be lengthy. Clear ownership and consistent use matter most.
When Barcode Scanning Makes Sense
Barcode scanning reduces repeated typing and can support more consistent receiving, shelf placement, transfers, cycle counts, and shipping. Labels must be readable and tied to the correct SKU. A small business does not need to automate every activity at once. For example, a distributor can begin by scanning incoming cartons and outgoing orders, then add transfer and count workflows after the team is comfortable with the process.
How To Build A Cycle-Counting Routine
Cycle counting means checking selected items throughout the year rather than relying solely on a single large annual count. Group A items, which are high-value, fast-moving, or high-risk, may be counted weekly or biweekly. Group B items can be counted monthly, while lower-risk Group C items may be counted quarterly. Pause movement in the selected area, count physical stock, compare it with the record, investigate differences, and document approved adjustments. Repeated variances should lead to process changes, not endless corrections.
Reorder Points And Safety Stock That Improve Inventory Accuracy
A practical reorder-point formula is: Reorder Point = Average Demand During Lead Time + Safety Stock.
The result is the stock level that should trigger a new order, so replenishment arrives before the shelf runs empty.
Calculate Demand And Lead Time From Records
Average demand is typical usage over a chosen period. Use recent transaction history rather than estimates, and pick a period long enough to smooth out one unusual week. Lead time is the period from placing an order to receiving it. Measure it from your own receiving dates rather than a supplier’s stated terms, and plan around the longest normal lead time rather than the fastest one. A reorder point built on a three-week lead time fails the first time a shipment takes five.
Set Safety Stock For Uncertainty
Safety stock is extra inventory held to manage uncertainty. A simple starting point is one to two weeks of average demand, raised when a supplier is unreliable, demand is volatile, or a stockout is expensive. Statistical service-level methods exist, but a small team is usually better served by a buffer it can explain, justify, and revise.
For Example
If average demand is 15 units per week, lead time is three weeks, and safety stock is set at two weeks of demand, then demand during lead time is 45 units and safety stock is 30. The reorder point is 75 units. When available stock reaches 75, place the order. Order quantity is a separate decision and should respect minimum order quantities, storage capacity, and cash flow.
Compare available stock rather than total stock. Subtract quantities already committed to open orders and add confirmed inbound shipments. An alert that ignores orders in progress will trigger too late or too early.
Review The Settings As Conditions Change
Review these settings when seasonal demand, supplier reliability, shelf life, storage capacity, minimum order quantities, or service expectations change. Put a review date in the calendar rather than waiting for a stockout to prompt one. Reorder points are only as reliable as the quantity on hand. If the system shows 80 units when 60 sit on the shelf, the alert arrives after the shortage has already started. This is why the stock-movement rules and cycle-counting routine covered earlier matter as much as the formula itself.
Managing Inventory Across Multiple Locations
Give every warehouse, store, vehicle, job site, and stockroom a clear location name. Track quantities by location rather than relying on one combined total, and require transfer records whenever stock moves. A service business with a central warehouse and two vehicles can then see which technician actually has a needed part. This prevents a team from promising inventory that exists somewhere in the business but is unavailable for the scheduled job.
Choosing Technology Without Overcomplicating The Process
Technology should reinforce a sound process, not hide a weak one. Useful capabilities include location-level tracking, barcode support, purchase and sales records, low-stock alerts, adjustment audit trails, mobile access, and reports for stock value, movement, aging, and discrepancies. Before you evaluate inventory management software, confirm that staff can use it with reasonable training, that data can be exported, and that it can record returns, transfers, damage, and adjustments. Begin with one workflow, such as receiving or cycle counting, before expanding the rollout.
Inventory Accuracy Metrics To Track
Inventory accuracy: the degree to which recorded quantities match physical counts.
Stockout rate: the percentage of time products are unavailable when needed.
Order accuracy: Tracks whether customers receive the right items and quantities.
Inventory turnover: Helps identify slow-moving or overstocked products.
Adjustment value: Highlights the financial impact of corrections.
Receiving accuracy: Reveals whether incoming shipments match expected quantities.
Choose three or four measures first. A small team is more likely to act on a short, consistent scorecard than on a large collection of reports.
A 30-Day Action Plan to Improve Inventory Accuracy
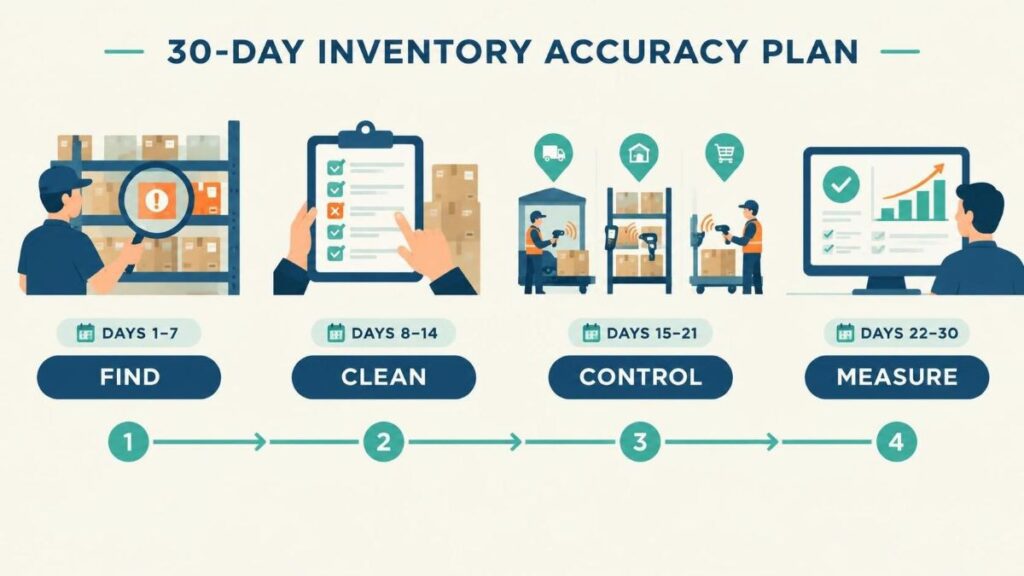
Process improvements stick when they are sequenced. This plan runs in four weekly stages: diagnose the biggest problems, clean the records, add control points, then measure the results. Each stage builds on the last, so resist skipping ahead. The infographic below shows how the 30 days fit together and where each task helps improve inventory accuracy.
Fog. 1: Action Plan to Improve Inventory Accuracy (illustration – AI Generated)
Days 1–7: Find The Biggest Problems
List products with frequent discrepancies, review recent stockouts and emergency purchases, and map the current receiving, picking, return, and adjustment processes.
Days 8–14: Clean The Records
Confirm SKUs, units, costs, and locations. Merge or retire duplicates carefully, and set rules for returned, damaged, expired, or missing goods.
Days 15–21: Add Control Points
Start cycle counts for important items, use a receiving checklist, require notes for adjustments, and clearly label shelves, bins, vehicles, and job-site stock.
Days 22–30: Measure And Improve
Compare count results with system quantities, identify the most common cause of discrepancies, establish a baseline for inventory accuracy and stockouts, and choose one process improvement for the following month.
Conclusion:
Small businesses can improve inventory accuracy by getting the basics right: clean product records, consistent stock-movement rules, regular counts, clear locations, and accountable adjustments. Once those controls are dependable, scanning, connected systems, and forecasting tools become far more valuable. Focus on one weak process at a time, measure the result, and build routines the entire team can follow.
FAQs to Improve Inventory Accuracy
How can a small business improve inventory accuracy without new software?
Start with clean product records, written rules for every stock movement, and regular cycle counts. Most small teams can improve inventory accuracy with these basics before buying any new software.
What causes inventory discrepancies?
The most common causes are manual entry errors, duplicate SKUs, late receiving updates, misplaced stock, unrecorded damage, and returns put back without inspection. Informal transfers between stores, vehicles, or job sites also create misleading totals.
How often should a business cycle count its inventory?
It depends on each item’s value and risk. High-value or fast-moving A items may be counted weekly or biweekly, B items monthly, and low-risk C items quarterly.
How do you calculate a reorder point?
Reorder Point = Average Demand During Lead Time + Safety Stock.
In practice, that is the stock level that should trigger a new order before the shelf runs empty.
What metrics should a small business track to improve inventory accuracy?
Start with inventory accuracy, stockout rate, and adjustment value. Pick three or four measures and review them consistently rather than building a large report set.
References:
Niekurzak, M., & Mikulik, J. (2026). Inventory segmentation and demand forecasting as tools supporting sustainable resource management in a manufacturing company. Sustainability, 18(8), 4047. https://doi.org/10.3390/su18084047
Shabani, A., Maroti, G., De Leeuw, S., & Dullaert, W. (2021). Inventory record inaccuracy and store-level performance. International Journal of Production Economics, 235, 108111. https://doi.org/10.1016/j.ijpe.2021.108111
Deven Nandapurkar is a Software Engineer, Project Lead; working at the strategic intersection of software engineering, productivity science, and emerging technologies. Driven by a core philosophy of "building things worth building," he leads cross-functional teams and drives end-to-end technical strategy—from early-stage conceptualization through production-grade deployment.
A Computer Engineering graduate from Pune University, Deven brings a sharp systems-thinking approach to technical leadership, honed by years of managing high-stakes engineering projects and leading teams to top placements in national and international hackathons, including the NASA Space Apps Challenge and the Peerlist GenAI Hackathon.
Deven explores how human cognition and emerging technology converge. He regularly writes about cognitive performance optimization, attention management, AI integration, and the evolving dynamics of the modern workforce - offering actionable frameworks for professionals seeking to maximize their productivity and thrive alongside intelligent systems.