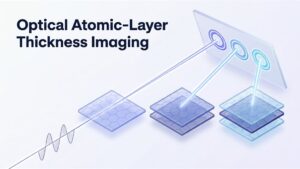
The number of atomic layers decides how a 2D material behaves, and a polarization trick now lets a simple camera image show whether a film is one, two or three layers thick.
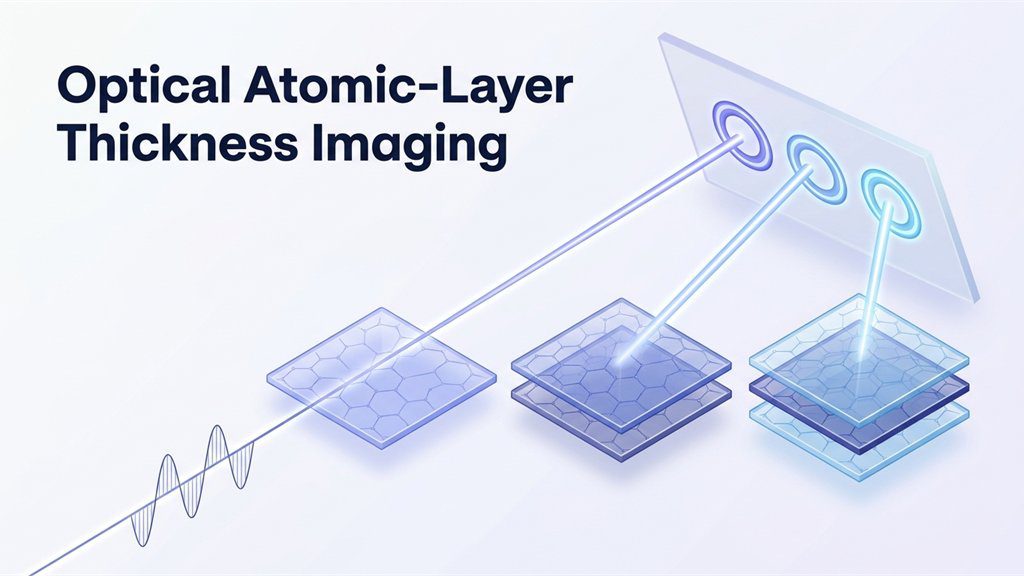
A single sheet of graphene is just one atom thick. Stack a second sheet on top, and its electrical behavior changes. That makes thickness one of the most important facts about any two-dimensional material. Yet counting such layers is awkward, because they are far too thin to see directly. Optical atomic-layer thickness imaging offers a simpler way to do it. In short, it uses polarized light to turn the layer number into a visible pattern. A two-dimensional (2D) material is a crystal only one or a few atoms thick. For example, one recent study read one, two or three layers from an image. This explainer covers why counting matters, how the trick works and where it leads.
Graphene was first isolated from graphite in 2004, and the 2D family has grown since. It now includes graphene, compounds called transition metal dichalcogenides and many stacked combinations. Within each sheet, atoms are bonded strongly. Between sheets, however, forces are weak, so thickness can be set layer by layer. As a result, the number of layers becomes a design choice, not just a measurement. For example, a single layer of such a compound has a direct bandgap. With a second layer, the bandgap becomes indirect, which changes how it handles light. Similarly, black phosphorus has a bandgap near 1.7 electron volts as one layer. In contrast, that value falls to about 0.8 in three layers. Engineers therefore need to know the exact count before building a device. ENTECH has covered a chip that guides single photons through atom-thin crystals.
Fig. 1: The Idea in Brief (Demonstrated in the Laboratory on One to Three Layers)
Why Existing Layer-Counting Tools Fall Short
Laboratories already have two families of tools for this job. The first family uses scanning probes, such as the atomic force microscope. These instruments offer near-atomic resolution and accurate thickness values. However, the paper notes that they need costly equipment and cover a small area. The second family is optical, and it includes Raman spectroscopy and photoluminescence. In addition, such methods are contact-free and can cover large areas. Even so, they read thickness indirectly from spectra and need careful calibration. Their reliability also depends on the material. According to the authors, Raman works well for graphene and molybdenum disulfide. It becomes less discriminating, though, for tungsten diselenide. That method has its own history, told in how the Raman effect was discovered. What has been missing is a simple image that shows the layer number directly.
Explainer: The Spin Hall Effect of Light and Optical Differentiation
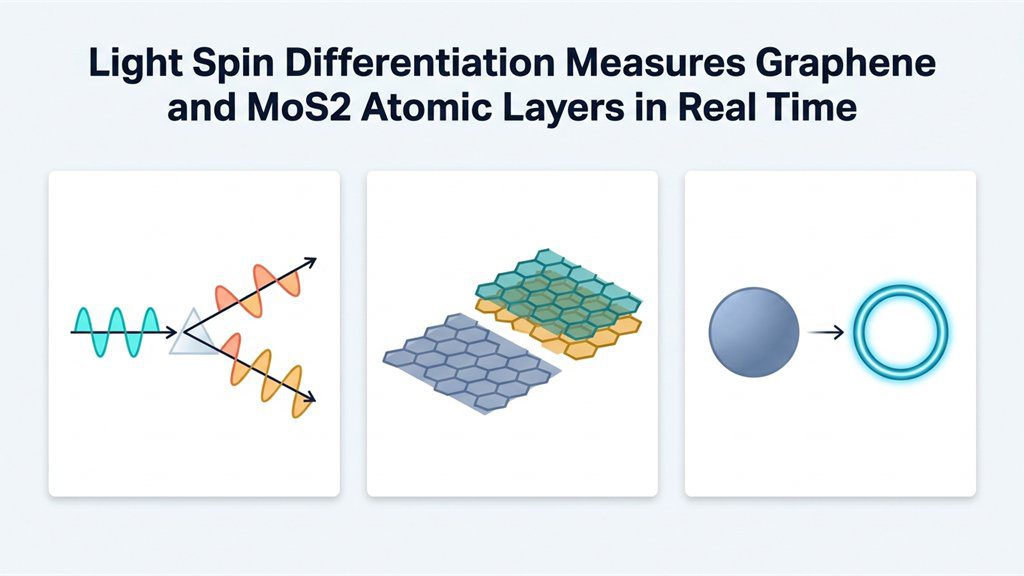
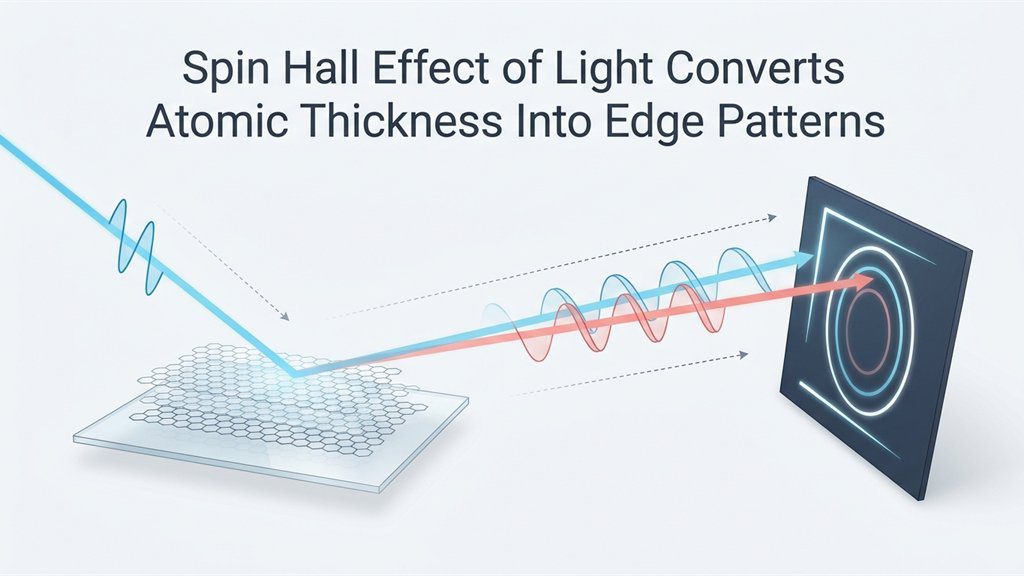
Two ideas from optics sit at the heart of the method. The first is polarization, which describes the direction in which a light wave vibrates. Circularly polarized light can rotate in one of two senses, often called its spin. When a beam reflects from a flat surface, opposite spins shift sideways in opposite directions. Physicists call this tiny shift the spin Hall effect of light. The second idea is differentiation, familiar from calculus as the rate of change. Likewise, an optical differentiator performs that operation on an image. Consequently, uniform regions go dark, while edges, where brightness changes, stand out. Photo software does something similar with its edge-detection filters. Here, though, the reflection itself does the mathematics, with no computer involved. Because reflection depends on the surface, the edge pattern reveals what the light touched.
Fig. 2: Reflection Shifts the Two Spin Components, and Edges Appear at the Detector
How Optical Atomic-Layer Thickness Imaging Works
Researchers at Hunan University in China and the University of Exeter built on those ideas. Their paper in Nature Communications describes a setup with very few parts. A single-color beam strikes the sample at an angle, and its reflection forms an image. Only three settings need adjusting: input polarization, output polarization and the angle of incidence. Standard polarizers and waveplates handle all three. No spectrometer, scanning probe or image post-processing is required, the authors report. The key is that reflection from a 2D material depends on its number of layers. Therefore, each added layer changes how the differentiation behaves. The team used a beam with a uniform circular profile, like a bright disk. What happens to that disk reveals the thickness. In fact, optical atomic-layer thickness imaging works in two different modes.
Mode One: An Edge That Turns Like a Dial
In the first mode, the setup differentiates the image along one direction only. As a result, only the edges facing that direction light up. The direction itself is the signal. Specifically, it rotates step by step as layers are added. The researchers overlaid a dial-like scale on the image for reference. On that scale, the edge direction points to the layer number like a clock hand. Bare glass, one layer and two layers of graphene each gave a clearly different angle. The measured angles also followed the theory closely without any fitting parameters. Above all, one snapshot is enough in this mode, which makes it fast. On the other hand, the angle is sensitive to the polarization and incidence settings. Careful setup is therefore needed to get the best contrast.
Mode Two: A Disk That Becomes a Ring
The second mode differentiates in every direction at once. To reach it, the team worked near the Brewster angle, where one polarization barely reflects. There, the whole outline of the disk lights up while its center goes dark. In other words, the disk turns into a ring. Crucially, this happens only for the layer number the setup is tuned to. Every other thickness still looks like a filled disk. So the answer is a simple yes or no, visible at a glance. The price is speed, because each layer number needs its own setting. Checking for three possible thicknesses, for instance, can take three measurements. Still, this mode proved forgiving in the team’s analysis. For instance, the ring survived moderate changes in input polarization. Calculations also showed it holding from 400 to 800 nanometers.
Fig. 3: Dial Mode Reads an Angle, Ring Mode Gives a Yes-or-No Answer
What the Experiments Showed
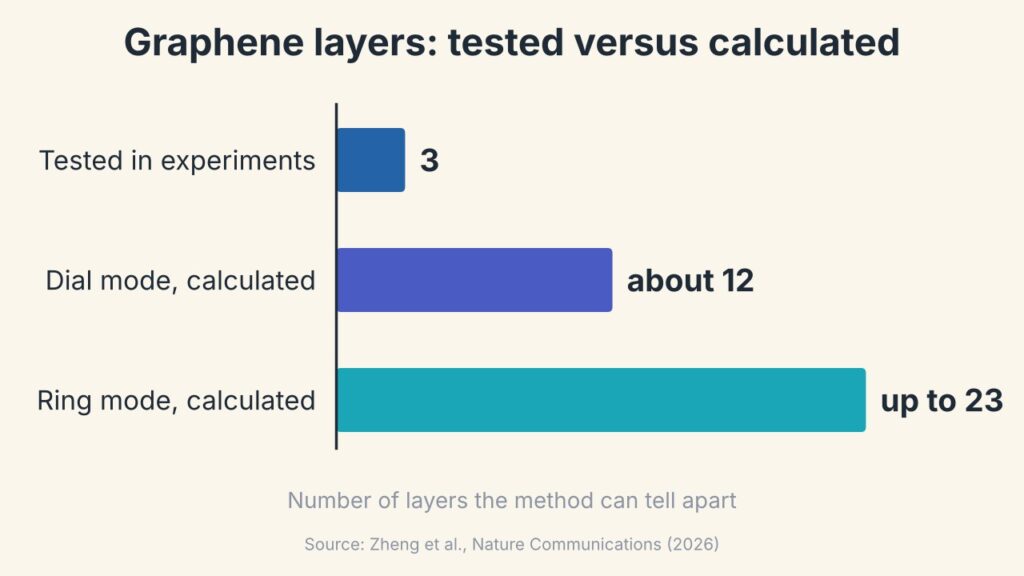
The team tested three materials: graphene, molybdenum disulfide and tungsten diselenide. Each film was grown by chemical vapor deposition and then transferred onto a glass prism. Thicker samples were then built by stacking single layers, one transfer at a time. For graphene, the ring mode clearly picked out one, two and three layers in turn. The other two materials are harder cases, since they absorb light more strongly. Elliptical polarization handled that problem, and the layer signatures stayed clear. Notably, this included tungsten diselenide, where Raman alone is less decisive. To confirm the true layer numbers, the researchers checked their samples with conventional techniques. Calculations, moreover, suggest more headroom than the experiments covered. In theory, the dial mode could separate up to about twelve graphene layers. Similarly, the ring mode could be tuned as far as twenty-three layers.
Fig. 4: Graphene Layer Range Shown in Experiments and in Calculations (Zheng et al., 2026)
Limits of Optical Atomic-Layer Thickness Imaging
The authors themselves call this work a proof of concept. So far, experiments cover only one to three layers of the three materials. Larger layer counts rest on calculations and still await testing. The samples were also transferred films on glass prisms, not finished devices. On a silicon base, the team’s analysis found that the ring mode becomes less selective. That matters, because silicon is the usual platform for chips. In addition, the output polarization and the incidence angle must be set accurately. The films themselves also showed wrinkles and residue from the transfer process. Importantly, the researchers present the method as a tool for rapid pre-screening. They describe it as “a complementary route” and not a replacement for established techniques. Optical atomic-layer thickness imaging should be read in that modest spirit.
What Faster Layer Counting Could Mean for Industry
Why would a simple layer counter matter outside the laboratory? The paper points out that 2D materials are moving toward scalable manufacturing. Production lines need quick checks, yet scanning probes examine one small spot at a time. Optical atomic-layer thickness imaging needs only simple optics, so it could suit routine quality control. However, no such industrial test has been demonstrated yet. The authors do suggest some natural next steps. For one thing, the dial-like edge patterns suit machine learning, which could automate large-area mapping. The same approach might also probe other properties, such as surface conductivity. Twisted and stacked structures are further targets they mention. More broadly, the work shows light performing a calculation that normally needs software. If such ideas mature, inspection tools could become simpler. A different route appears in a microscope that lights up hidden 2D material.
Lessons for Students and Teachers
This topic rewards students who enjoy both physics and mathematics. Polarization, reflection and the Brewster angle all appear in school optics. Differentiation, meanwhile, comes straight from a first calculus course. Here the two meet, since a light beam effectively takes a derivative. A classroom can explore the ideas with very simple tools. For example, two polarizing filters show how polarization controls brightness. Likewise, a few lines of code can run an edge-detection filter on a photo. Comparing that result with the optical version makes a good discussion. Teachers might also ask why edges carry so much information in an image. Above all, the study shows that simple components can answer a subtle question. Clever arrangement, not expensive hardware, did the work.
Careers and Startup Ideas in Optical Inspection
Several kinds of specialists stand behind a result like this. Photonics engineers design optical systems and choose their components. Materials scientists, in turn, grow and transfer the atom-thin films. Physicists, meanwhile, develop the theory that predicts each pattern. Useful skills therefore include optics, electromagnetism, programming and careful laboratory alignment. Image analysis is valuable too, given the possible link with machine learning. Entrepreneurs may see openings as well. For instance, one idea is an add-on module that gives a standard microscope this capability. Another is a monitor that watches films while they grow. Both are untested, so they should be treated as possibilities only. Even so, measurement is a quiet but essential part of every new technology. People who make hard measurements easy often move a whole field forward.
References
Zheng, D., Liu, C., Yang, Q., Zhao, Y., Wen, S., Luo, H., & Chen, S. (2026). Encoding atomic-layer thickness via spin-dependent optical differentiation. Nature Communications. https://doi.org/10.1038/s41467-026-78379-y
This explainer presents a subtle optical method clearly, and the dial and ring comparisons give readers an easy way to keep the two modes apart. The limits section rightly stresses that the work is an early demonstration, and a later update could report tests on thicker samples or on chip-grade substrates when they appear. A sentence or two on how polarizers and waveplates work would help younger readers. Readers are encouraged to turn to the original research paper for the full derivations and data.
Editorial note
This article is an ENTECH explainer on why the number of atomic layers matters in two-dimensional materials and how polarized light can make that number visible, written for students, teachers and early-career readers. It draws on a peer-reviewed research paper, and the illustrations are original graphics prepared for ENTECH rather than figures taken from the paper. Readers who want full details should refer to the original source paper listed in the references.
I am a Physics graduate with a strong academic interest in statistical mechanics, complex systems, computational physics, and the study of collective behaviour in interacting systems. During my undergraduate studies, I developed an interest in understanding physical phenomena not only through theoretical concepts but also through computational modelling and simulation. As part of my academic work, I explored the Ising model using Monte Carlo simulations and studied the Active Ising Model to investigate collective behaviour, density variations, and phase transitions in active systems. These projects introduced me to computational approaches in physics and strengthened my interest in understanding how simple microscopic interactions can give rise to complex macroscopic behaviour. Alongside my academic interests, I am passionate about education and science communication. I have experience helping students and peers understand concepts in physics and mathematics, with an emphasis on intuitive explanations rather than simply memorising formulas. I enjoy connecting scientific ideas to everyday experiences and presenting complex topics in a way that is clear, engaging, and accessible. I am also interested in the role of technology in education and the development of digital learning resources. Through writing, teaching, and educational projects, I hope to contribute to making scientific knowledge more accessible to students and curious learners. My broader interests include non-equilibrium statistical mechanics, active matter, phase transitions, computational modelling, complex systems, and science education. Through my work, I aim to continue developing as a researcher while contributing to science communication and education.