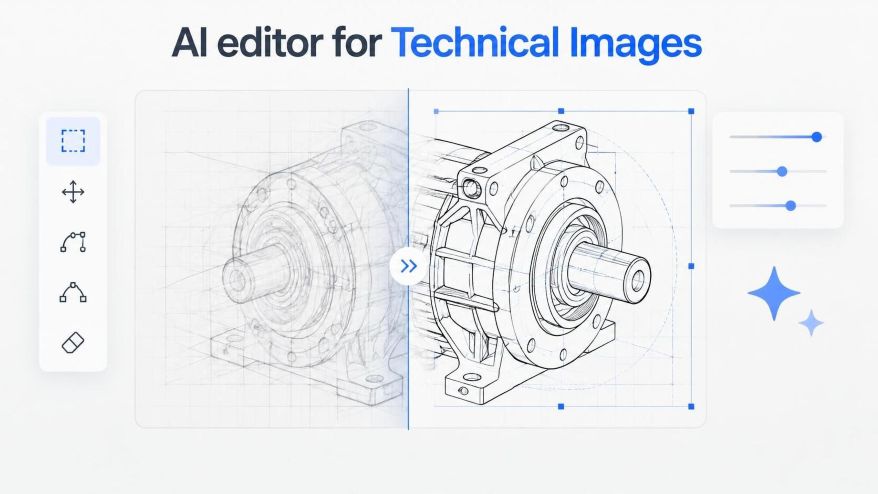
Technical image processing/publishing for STEM often stalls when diagram adjustments demand tedious manual layer cleanup. Adopting a versatile AI Photo Editor allows teams to refine technical imagery, isolate components, and produce sharp figures without rebuilding every visual asset from scratch.
Modern science and engineering journals require crisp diagrams, clean schematics as well as high-contrast figures that reproduce legibly across both digital platforms and printed formats. When researchers or editorial teams receive raw captures, microscopy stills, or system schematics, those assets often carry sensor noise, uneven backgrounds, or compression flaws. Spending multiple hours manually masking and redrawing vector boundaries delays publication schedules and pulls technical specialists away from substantive analysis.
Image Processing for STEM: Preparing Complex Technical Imagery For Digital Publication
Before applying automated tools to technical images, authors must evaluate the fundamental structure of the visual data. Technical figures differ sharply from commercial marketing graphics because every curve, indicator label, and boundary represents measurable information rather than decorative styling. A cleanup pass that accidentally smooths away a faint sensor reading or alters a plot line damages the integrity of the published work. Applying proper image processing for different stem disciplines ensures that technical data remains accurate as well as scientifically valid.
In standard laboratory workflows, images arrive in diverse container formats, ranging from uncompressed PNGs to heavily compressed WebP or JPEG files capped below 30 MB. Establishing an intake protocol ensures that the original pixel resolution remains untouched while targeted corrections address peripheral clutter. Using a reliable editing platform allows contributors to process figures in a controlled environment where background noise can be separated from essential diagrammatic structures.
Effective preparation also involves setting resolution boundaries early. When an editorial desk prepares charts for multi-column academic layouts, visual elements must maintain sufficient pixel density to prevent blurry rasterization upon zooming. Isolating the primary scientific subject from distracting backdrops provides a neutral baseline for subsequent layout compositing and peer review distribution.
Laboratories frequently handle multi-panel figures where individual sub-elements originate from different diagnostic instruments. If one panel exhibits muddy contrast while another displays razor-sharp vectors, the entire composite looks disjointed. Normalizing dynamic range and clipping thresholds prior to detailed retouching prevents uneven tonal shifts that complicate figure captions and comparative readings.
Step By Step Protocol For Precision Artifact Cleanup
Refining technical visuals requires a methodical procedure that prioritizes data fidelity over aggressive creative restyling. The following sequence establishes a reliable path from raw laboratory capture to publication-grade figure.
Isolating Key Diagram Components And Stripping Distractions
The initial phase focuses on background normalization. Begin by uploading the source file into the editing workspace and selecting the background removal tool to eliminate uneven lighting gradients or scanning artifacts. If the visual contains peripheral labels or stray measurement artifacts that belong elsewhere, apply targeted object erasure to clear those regions cleanly without smudging adjoining line work.
During this stage, precision is critical around thin structural boundaries. An advanced AI Image Editor identifies contrasting edges accurately, preserving fine lines while discarding mottled gray backgrounds. Rather than relying on fuzzy brush strokes, the underlying segmentation models calculate pixel probability maps that maintain crisp separation around delicate schematic traces.
Whenever high-contrast boundaries intersect with faint grid lines, authors should inspect the segmentation mask closely. Discard any selection that clips intentional reference lines, and re-run targeted removal exclusively on empty canvas regions to avoid eroding essential data indicators.
Restoring Fine Lines And Edge Sharpness Across Scaled Figures
Once peripheral clutter is eliminated, the second phase of image processing for stem figures addresses resolution enhancement. Older diagrams or low-resolution sensor screen grabs often exhibit severe pixelation when enlarged for full-width journal figures. Applying an upscaling pass set to 2X or 4X reconstruction rebuilds sharp transitional edges along mathematical curves and structural components.
However, editors must inspect this upscaling pass closely to confirm that geometric lines remain strictly linear rather than taking on curved, painterly distortions. Modern workflows enhance these details by interpolating structural contours. As a result, mechanical drawings and laboratory figures retain their precise technical proportions without introducing synthetic details that misrepresent physical equipment.
If an upscale algorithm produces faint halos or line thickening around alphanumeric labels, reduce the sharpening radius and re-evaluate character legibility. Keeping stroke weights consistent across mathematical superscripts and subscripts prevents ambiguities during peer review inspection.
Using Image Processing Responsibly in STEM Education
Image processing can help STEM students communicate scientific observations more clearly. In science projects, robotics reports, and also classroom experiments, photographs and diagrams often support explanations of how a system works or how an experiment was conducted. However, improving an image’s appearance should never change the information it represents.
Students, teachers, and parents can use image processing to improve readability, organize visual materials, and prepare project presentations. The most important principle is to preserve the original observations and measurements throughout the process.
For High School Students
Science fair projects, robotics activities, and laboratory experiments often involve photographs, diagrams, and recorded observations. Image processing can help students prepare these materials for reports and presentations.
Students can use image editing tools to:
Improve Image Readability: Adjust brightness, contrast, or cropping to make laboratory photographs and project diagrams easier to understand. Keep the original image available for comparison.
Organize Scientific Observations: Arrange photographs from different stages of an experiment to show the procedure, setup, and results clearly.
Prepare Visual Presentations: Use labels, captions, and diagrams to explain experimental methods and observations. Ensure that added annotations do not change the original measurements or findings.
Understand Scientific Image Integrity: Learn the difference between improving image presentation and modifying scientific evidence. Record any processing steps that affect how an image appears.
For example, students conducting a plant growth experiment may adjust the brightness of photographs to improve visibility. However, they should not alter the plant’s dimensions, remove relevant experimental details, or change the appearance of the observations to suggest a different result.
Students should retain the original photographs and use actual measurements when reporting experimental findings.
For Teachers and Educators
Teachers can use image processing to prepare instructional materials, explain scientific concepts, and help students interpret visual information.
Responsible image editing can support classroom activities such as:
Preparing Clear Learning Materials: Improve the readability of diagrams, charts, and laboratory photographs used in lessons and presentations.
Creating Educational Worksheets: Crop or organize diagrams to focus on a specific concept. Clearly distinguish edited teaching illustrations from original scientific observations.
Teaching Scientific Data Integrity: Demonstrate how image adjustments can affect interpretation. Ask students to compare original and processed images and identify changes in brightness, contrast, scale, or detail.
Developing Visual Literacy: Help students evaluate whether an image accurately represents the information it is intended to communicate.
Teachers should explain that image enhancement does not establish the accuracy of an observation. Students must still check measurements, experimental records, and source information when interpreting scientific results.
When using diagrams or images from textbooks and other sources, educators should also retain appropriate attribution and follow applicable copyright requirements.
For Parents Supporting STEM Learning
Parents can support students by encouraging clear, accurate, and responsible presentation of science projects.
Rather than focusing only on the appearance of a poster or report, parents can help students:
Keep original photographs, diagrams, and experimental records.
Explain what each image shows and how it relates to the project.
Check that image adjustments do not change measurements or observations.
Use captions and labels to make scientific information easier to understand.
Review the final presentation while allowing students to make their own scientific decisions.
Parents can also encourage students to explain which image adjustments they made and why. This helps them understand that scientific communication requires both visual clarity and accurate evidence.
Preserving Original Observations and Measurements
Image processing should support scientific communication, not replace experimental evidence.
Students should follow a few basic practices when preparing images for science projects:
Keep the original image: Save an unchanged copy before applying any adjustments.
Use appropriate edits: Apply basic corrections such as cropping, brightness, or contrast when they improve readability without changing relevant information.
Preserve measurements: Do not alter scale bars, dimensions, graph values, experimental labels, or other quantitative details.
Document significant changes: Record processing steps that could affect how readers interpret the image.
Compare the final image with the source: Check for missing details, altered boundaries, or unexpected changes.
Verify scientific findings independently: Use original observations, measurements, and experimental records to support conclusions.
AI-based enhancement requires additional care because some tools may generate or reconstruct details that were not clearly present in the original image. Such details should not be treated as experimental observations.
If an edited image changes an important scientific feature, students should use the original image or another suitable representation of the data.
Ultimately, image processing can help STEM students present their work more clearly while developing responsible scientific communication habits. By preserving original observations, checking measurements, and explaining their editing choices, students can use visual tools to support their projects without compromising the accuracy of their findings.
Balancing Visual Clarity Against Production File Size Targets
While maximum magnification yields impressive visual clarity, editorial teams must remain mindful of digital repository constraints. Many technical publishing platforms enforce strict file size ceilings, often capping individual figure uploads at 15 MB to ensure rapid loading on mobile devices and institutional reader portals.
Exporting finalized figures as optimized PNG or WebP files strikes the appropriate balance between lossless contrast and manageable network payloads. Inspecting the final exported file at 100 percent view confirms that small font annotations and subtle measurement scale bars remain immediately readable without chromatic fringing.
Teams should also establish standardized naming conventions indicating resolution scale and processing date. This tracking practice eliminates accidental version conflicts when figures undergo post-review adjustments or layout reflows.
Preventing Common Generative Artifacts In Systematic Schematics
Applying neural processing tools to technical diagrams requires strict quality controls to avoid unintended modifications. Generative algorithms trained predominantly on organic photographic scenes can sometimes misinterpret technical symbols, mistaking parallel measurement tick marks for background texture or attempting to soften intentional hard angles.
To avoid these pitfalls, editors should avoid open-ended prompt descriptions when executing technical cleanup. Restrict instructions to unambiguous operations such as removing solid backdrops, sharpening existing line art, or repairing pixelated boundaries. When fine text annotations exist within the image, verify that character letterforms have not been subtly altered or replaced with unreadable glyphs during the reconstruction phase.
A reliable verification protocol involves layering the processed output over the raw source image in a draft comparison viewer at fifty percent opacity. If coordinate axes shift or line paths drift from their original geometry, editors must discard the flawed export and adjust parameter constraints. Automated processing is not a substitute for human review when verifying quantitative figures, ensuring predictable structural retention across multi-panel assemblies.
Authors cannot afford to overlook small diagrammatic inconsistencies that might invalidate experimental conclusions. Catching minor edge distortions or warped chart markers during pre-flight checks prevents costly post-publication errata and maintains institutional credibility.
Building A Dependable Asset Pipeline For Technical Publishing
Integrating automated image processing tool into STEM publishing workflows bridges the gap between academic authors and professional production standards. Rather than bouncing drafts back to researchers because of sub-par figure resolution or distracting gray backgrounds, editorial staff can remediate assets in minutes.
Teams handling continuous submissions benefit from standardizing their cleanup parameters across recurring document series. Utilizing a centralized enhancement utility allows editorial assistants and technical authors alike to produce consistent, publication-ready figures that meet rigorous visual standards without burdensome software licensing overhead or extensive graphic design training.
Routine production checks should be documented in a shared editorial handbook. By defining acceptable magnification ceilings, approved color profiles, and baseline sharpness metrics, organizations ensure that every published graphic conveys empirical findings with fidelity and distinction.
Ultimately, technical communication relies on absolute clarity. When complex experimental findings and intricate engineering designs are supported by pristine, well-resolved imagery, readers can focus entirely on the substance of the research. Streamlining figure production ensures that valuable technical insights reach the scientific community faster and in their clearest possible visual form.
References:
Li, Q., Huang, G., Feng, C., Zhao, W., & Wang, Y. (2026). Generative AI in STEAM Education: Applications and Development Prospects for Promoting Artistic Creativity. Education Sciences, 16(7), 1012. https://doi.org/10.3390/educsci16071012
Crowther, G. J., Paustian, T. D., & Parks, S. T. (2026). Practical and positive uses of AI in STEM education: taming the AI tiger. Journal of Microbiology and Biology Education, 27(2), e0020226. https://doi.org/10.1128/jmbe.00202-26
FAQs: Image Processing for STEM
1. What is image processing in STEM?
Image processing in STEM involves editing, enhancing, and organizing scientific images, diagrams, and photographs to improve their clarity and presentation.
2. How can students use image processing in STEM projects?
Students can use image processing to improve photographs, prepare diagrams, organize experimental observations, and create clearer science project presentations.
3. How can AI image editing help with science projects?
AI image editing can help students improve image readability, remove distracting backgrounds, and prepare visual materials for reports and presentations.
4. Why should students preserve original images during image processing?
Preserving original images helps students verify their observations, maintain accurate measurements, and ensure that image edits do not change scientific evidence.
5. How can students use AI image processing responsibly?
Students should retain original images, document significant edits, verify measurements, and ensure that AI enhancements do not alter scientific observations or experimental results.
Sailee Pakhare holds a Master's degree in Biotechnology, with a research background spanning microbiology, molecular biology, and disease biology. Her postgraduate dissertation examined the antimicrobial potential of bioactive peptides from lactic acid bacteria, and her research experience includes molecular identification of bacterial isolates (with sequencing data submitted to NCBI) and work as a Research Assistant at SafeWright Laboratory. She also completed a summer internship at IIT Hyderabad studying circadian rhythms and disease biology using Drosophila melanogaster as a model organism.
Her work has been recognized with the Best Poster award at the 3rd International Conference on Innovations in Biotechnology Research for Sustainable Bioresources and Bioeconomy (2025), and she has contributed to a book chapter on the role of AI and machine learning in climate change.
Sailee is also a co-founder of LifeXtension, a community focused on longevity, ageing, and health science awareness in India. An interdisciplinary thinker, she explores questions ranging from disease biology to space and the origins of life, approaching science as a way of asking questions rather than a fixed body of facts. As a science communicator and researcher, she is committed to translating complex research into writing that is clear, accurate, and engaging.
Ishika Tawar is a biotechnology researcher and science enthusiast with a curiosity for understanding how life works at the molecular and cellular level. That curiosity started somewhere around school, wandered through a lot of unrelated corners of science and physics, and eventually settled on something she actually wants to spend her life on: aging and longevity. She supports transhumanism and believes that science and technology should be explored seriously as tools to overcome some of the biological limitations of the human body.
Ishika holds a Master's degree in Biotechnology and has experience in both wet-lab and computational research. At ACTREC, she worked on a project studying the interaction of the TG2 protein with the ribosome, where she gained experience in cloning, site-directed mutagenesis, transformation, and gene knockdown. She was also involved in studying ribosomal heterogeneity using R and publicly available single-cell RNA sequencing datasets from different cancers. As a Research Assistant at SafeWright, she worked on client-based projects involving microbial culturing, biochemical tests, and analysis, along with literature research, report writing, and preparation of laboratory protocols. She has also worked with Python-based analysis to study differential DNA methylation in breast cancer.
Her current areas of interest include epigenetics, genomics, gene therapy, stem cell biology, computational biology, and the use of AI in biological research. She is particularly interested in how these areas can contribute to understanding aging and developing ways to extend healthy human lifespan. She has explored this interest through research projects and hackathons focused on AI, aging, and longevity. She enjoys following ideas across biology, technology and physics, and she believes in evidence, questioning ideas and staying curious about things that are not yet understood.
Outside research, Ishika enjoys reading and talking about science and scientific ideas. She loves travelling and is especially fond of mountains. She also enjoys science communication and hopes to make scientific topics easier to understand without making them inaccurate or oversimplified.