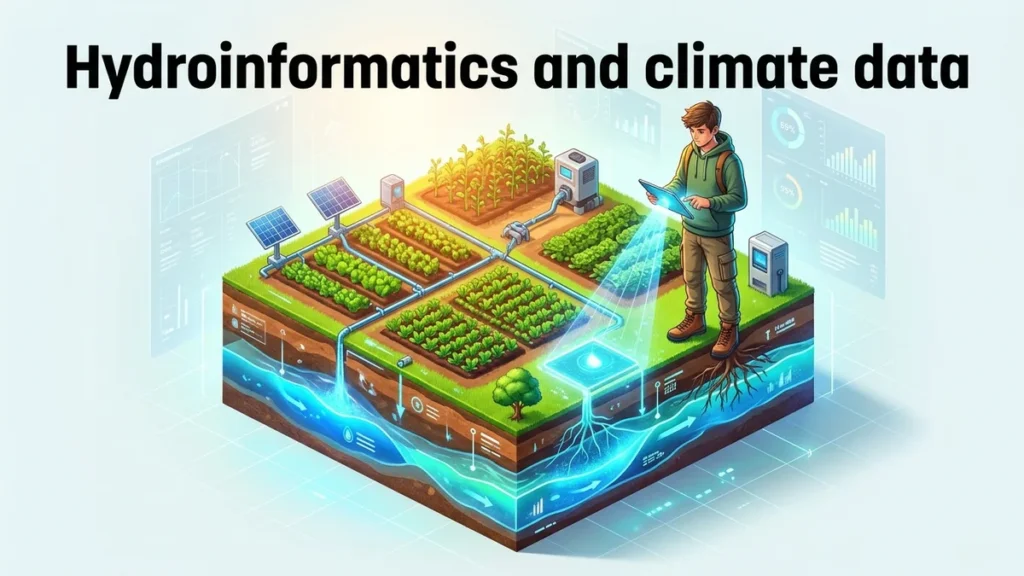
Brazil holds more renewable fresh water than any other country on Earth. Most people never see much of it, because it sits underground. According to Princeton researchers, groundwater helps sustain 90% of Brazil’s rivers. It also supplies water to more than half of the country’s municipalities. Even so, scientists have lacked a detailed national view of where it lies. At last, that gap is closing, thanks to hydroinformatics and climate data. Hydroinformatics uses computing, statistics and data science to solve water problems. During September 2026, a Princeton team published the first detailed water table map of Brazil. In short, their model estimates groundwater depth for roughly one billion grid cells. Each cell measures 90 meters on a side, or about two acres. As a result, planners get far more local detail than older global maps offered. So what did the team build, and why does it matter?
Groundwater fills the tiny spaces between soil grains and inside cracked rock. The top of this soaked zone is called the water table. Its distance below the ground is known as water table depth, or WTD. For instance, the water table sits just a few meters down in some places. In other places, a well must go hundreds of meters to reach it. For this reason, depth matters a great deal to farmers, cities and forests. Shallow groundwater can feed plant roots, wetlands and rivers during dry seasons. In contrast, deep groundwater costs more to pump and is harder to reach. Brazil spans about 8.5 million square kilometers, from rainforests to seasonal savannas. Given that range, a single national average would tell you very little. In other words, managing water wisely requires local detail.
Subsurface Water Modeling With Too Few Wells
Measuring groundwater directly means drilling a well and recording its water level. Brazil’s government records include about 158,000 wells with such measurements. That sounds like plenty, yet the country is enormous. According to the study, monitoring density is below 0.02 wells per square kilometer. Most readings come from one-time pumping tests, not repeated checks. The data came from Brazil’s Geological Survey, the Serviço Geológico do Brasil. Researchers led by Gescilam Uchôa had already cleaned and checked those records. In any case, each well describes just one spot on the map. Vast areas between wells have no direct readings at all. Subsurface water modeling exists to fill those gaps with reasoned estimates. Without it, the space between wells would remain largely blank on any national map.
How Princeton Built High-Resolution Groundwater Mapping for Brazil
The project grew out of the master’s thesis of Maria Fleury. She is a Princeton graduate student originally from Rio de Janeiro. Fleury worked with Yueling Ma and Reed Maxwell, a professor of civil and environmental engineering. Earlier in 2026, Maxwell’s group had mapped water levels across the United States. That earlier map used cells about 30 meters wide. With this in mind, the team turned its methods toward Brazil. To begin with, Fleury paired the well readings with national data on factors affecting groundwater. Then the model learned how those factors relate to measured depths. After that, it predicted depth everywhere, including places with no wells nearby. In the end, the map covers the entire country at a single, consistent resolution. The team described the work in a paper in Environmental Research Letters.
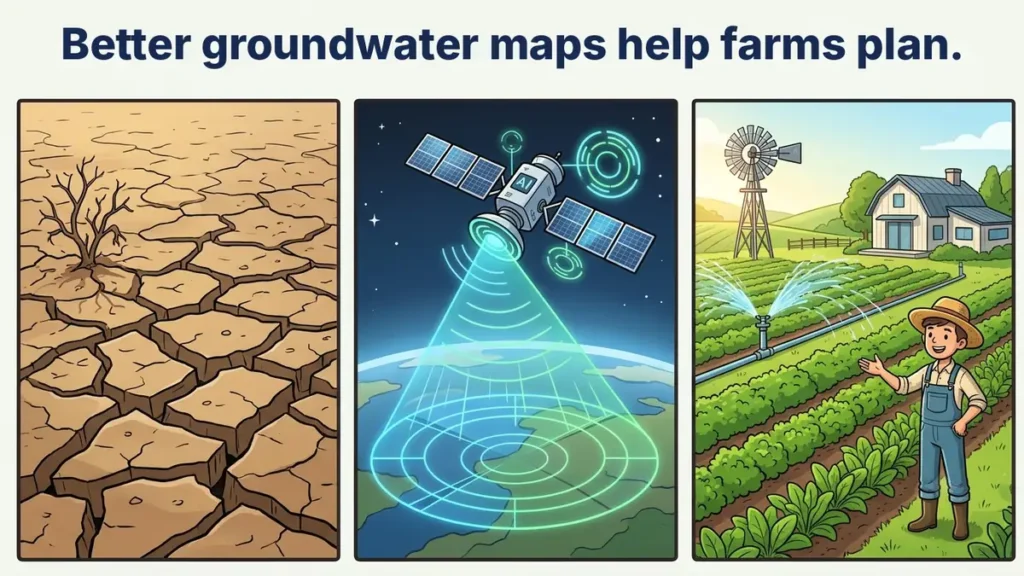
Fig. 1: Better Groundwater Maps Can Help Farms Plan Ahead
What a Random Forest Actually Does
Princeton’s team used a machine learning method called a random forest. In essence, it combines the answers of many simple decision trees. Each tree asks a chain of yes-or-no questions about a location. For example, one question might ask whether an area is wet or dry. Each tree also trains on a slightly different random sample of the data. As a result, the trees give slightly different answers for the same spot. In this case, the model used 300 trees and took their middle answer, the median. Similarly, a panel of judges is often fairer than one judge. Random forests are popular in hydroinformatics and climate data work, since they handle messy data. On the other hand, they can behave like black boxes. That is why the team also studied how its model behaved.
What the Map Reveals About Brazil’s Water Table
On the whole, the headline finding is encouraging for water planners. About half of Brazil’s land has a water table shallower than 12 meters. That figure agrees with direct observations reported by Uchôa and colleagues. By comparison, roughly 32% of the land has water within 10 meters of the surface. Only about 5% has a water table shallower than 5 meters, though. Scientists often treat these shallow depths as reachable for plant roots and ecosystems. At the other extreme, some locations reach depths of about 420 meters. According to the authors, the estimates match well observations closely. Fleury also reports a substantial improvement over global physics-based estimates. Those older estimates had served as the main reference for Brazil until now. Taken together, the results show where water is likely within reach and where it is not.
Measuring the Model’s Own Uncertainty
A trustworthy map should also say how sure it is. For this purpose, the team produced a second map of prediction uncertainty. In other words, it shows how much the 300 trees disagree at each location. Specifically, it uses the interquartile range, the spread of the middle half of answers. In places where trees disagree widely, users should treat the estimate with care. Where they agree, the estimate is at least consistent. Agreement among trees is no guarantee of accuracy, but it is a useful warning signal. For that reason, this kind of openness matters for anyone planning wells. In addition, it can hint at where new monitoring wells might help most. Good science, after all, tells you what it doesn’t know.
Why Farms and Supply Chains Need Hydroinformatics and Climate Data
Brazil is one of the world’s largest agricultural producers. As a matter of fact, many of its farms rely on irrigation, and some use wells. According to Princeton, the map could help scientists study both irrigation and climate change. Knowing the depth of the water table helps estimate how hard pumping will be. It can also show where shallow groundwater supports rivers and wetlands. For businesses in particular, water risk can mean crop losses and supply delays. Food companies, insurers and lenders therefore track where water may run short. At the same time, governments need evidence before setting rules on pumping. In effect, hydroinformatics and climate data give these groups a shared starting point. Of course, a depth map alone cannot settle how much water anyone should use. Even so, it makes those conversations far better informed.
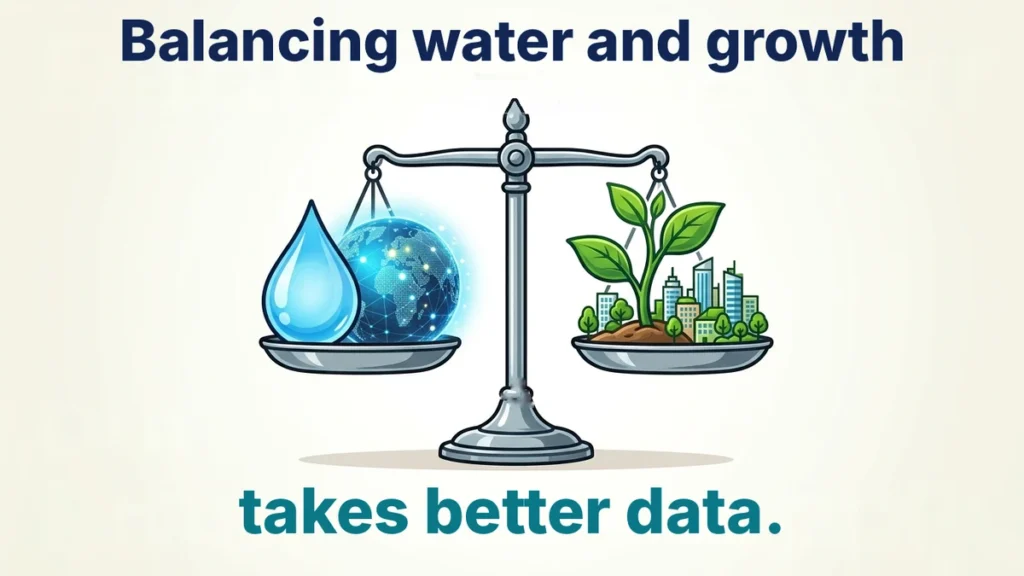
Fig. 2: Balancing Water Needs Depends on Good Data
A Wider Pattern of Aquifer Stress
Other recent work adds urgency to these questions. In June 2026, a NASA-led team published a study in Science Advances. It used satellites, wells and artificial intelligence to track Brazil’s groundwater from 2002 to 2023. The NASA summary of that study reports persistent declines in several aquifers. These aquifers lie in central and eastern Brazil, a key farming region. Together with drought and deforestation, agriculture, mining and rising extraction all play a part. According to NASA, Brazil’s aquifers supply about 55% of its water. Princeton’s map shows how deep the water table sits across the country. By comparison, the NASA work tracks how stored water changes over time. Used together, the two approaches could help managers see where pressure is building.
Career Paths in Environmental Civil Engineering
Work like this needs people who understand both water and data. Civil engineers design water systems, dams and drainage, and many specialize in water resources. The US Bureau of Labor Statistics puts their median pay at $100,840 in May 2025. It projects 6% job growth from 2025 to 2035, faster than average. Environmental scientists and specialists earned a median of $82,220 in May 2025. Their jobs are also projected to grow 6% over the same decade. In contrast, hydrologists, who study how water moves underground, form a smaller group. The BLS, in particular, expects little change in hydrologist numbers through 2034. These are US figures, but water-data skills are in demand worldwide. Careers in hydroinformatics and climate data also include groundwater modelers, GIS analysts and data scientists.
Skills Students Can Build Now
Start with strong mathematics, especially algebra, statistics and some calculus. Then add earth science, because models only make sense if you understand the ground. Learn Python early, since most hydroinformatics and climate data tools rely on it. Mapping software, known as GIS, is another valuable skill to practice. For a first project, download rainfall records for your town and chart them by month. After that, compare dry and wet years and ask what changed. Reading about real water problems helps too, such as aquifers shrinking along crowded coastlines. Our story on a sun-powered reactor that cleans well water shows the treatment side. Above all, stay curious about the water beneath your own feet.
Limits Worth Keeping in Mind
Note that a map like this is an estimate, not a direct measurement. Accuracy depends on the wells behind it, and some regions have very few. Most readings come from single tests, so the map cannot show seasonal swings. Each 90-meter cell also averages out variation within that square. Under those circumstances, nobody should drill a well based on this map alone. Local surveys and testing are still essential before any real project. The map also describes depth, not water quality or the total volume stored. Moreover, fresh well data will be needed as pumping and climate shift. With these limits in mind, the work remains a major step for Brazil. In the long run, it gives hydroinformatics and climate data researchers a detailed baseline.
References
Fleury, M. P., Ma, Y., & Maxwell, R. M. (2026). High resolution estimates of water table depth across Brazil: Insights into model behavior and data challenges. Environmental Research Letters, 21(17), 174025. https://doi.org/10.1088/1748-9326/ae9bd7
The piece explains water table depth, random forests and prediction uncertainty in clear, student-friendly terms. It reports the study's main figures accurately and separates them from the NASA-led work on aquifer decline. The business and career sections stay cautious and note that the job figures are from the United States. Readers who want the methods and data in full should check the original paper this story draws on.
Editorial note
ENTECH is running this story because groundwater is one of the least visible and most important water supplies on Earth. The new Brazil map shows students how well records, statistics and machine learning combine to answer a real environmental question. It also connects to careers in water engineering, environmental science and data analysis. The map is a modeled estimate rather than a direct measurement, and its authors publish an uncertainty map alongside it. For the full details, we suggest readers turn to the original research paper and the university's news story.
I completed my Master of Science from the University of Allahabad in 2017 with a strong academic background in life sciences and chemistry. My specialization included Molecular Biology, Microbiology, Genetics, Plant Breeding, Phycology, Paleobotany, and Bioinformatics, along with Organic Chemistry, Inorganic Chemistry, and Physical Chemistry. This multidisciplinary training provided me with a comprehensive understanding of biological systems and analytical scientific approaches.
After completing my postgraduate studies, I gained valuable professional experience in both the education and social development sectors. I worked at A.M. Oxford Public School, where I was actively involved in guiding students toward academic excellence. In this role, I focused on creating an engaging learning environment, encouraging critical thinking, and nurturing students’ curiosity for scientific learning. My experience as an educator strengthened my communication, mentoring, and classroom management skills.
In addition to my teaching experience, I worked with Jeevan Jagriti Foundation, where I contributed to community-based initiatives aimed at improving educational access and awareness among underprivileged sections of society. Through this work, I participated in programs designed to support social development and promote the value of education in marginalized communities.
These professional experiences helped me develop strong interpersonal, leadership, and organizational skills while reinforcing my commitment to education and community service.