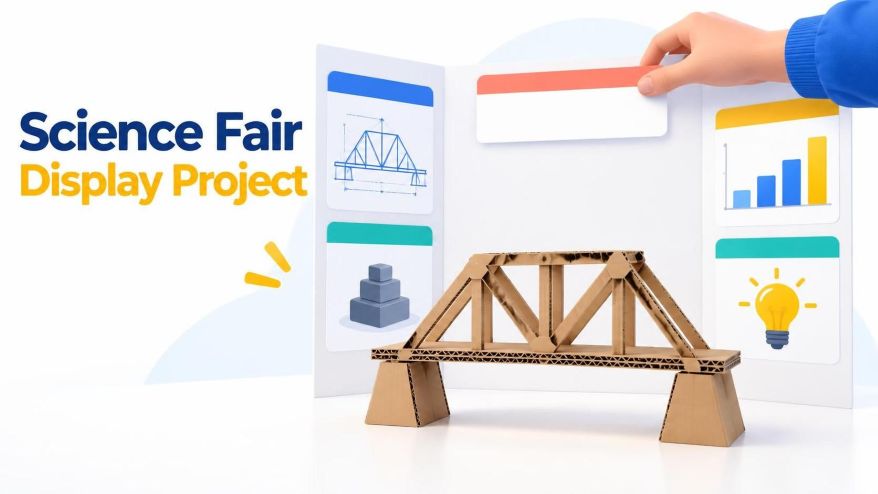
Learn how to create an effective science fair display for a cardboard bridge project. Keep the real model and data central while using clear visuals to explain the design.
A science fair display should be clear and easy to follow. For a cardboard bridge project, the model should remain the main focus. Avoid filling the board with decorative images that distract from the student’s work. A clear photograph of the bridge on a plain surface can show its triangular supports and overall shape. Leave enough space for actual measurements, photographs, and explanations.
Start with a real bridge model and take photographs from useful angles. Include a broad side view, a close-up of the joints, and an overhead view of the deck. These photographs provide evidence of the student’s work. A separate illustration can introduce the project, but it should not replace real observations or suggest that an experiment took place when it did not.
Before creating any illustrations, sketch a rough layout of the display board. Place a large image on the left, the project question on the right, and the results below. Adjust the layout to fit the available space. This step helps determine whether the illustration needs a wide horizontal view or a more compact, angled composition.
Tools such as Seedream 6.0 can help create an introductory illustration. However, the student’s photographs should remain the main reference for the model’s construction. Keep the illustration simple and clearly separate it from the experimental evidence. Use it to introduce the project, not to represent measurements or prove a scientific claim.
Choose an angle that explains the structure
A low three-quarter view can show both the side supports and part of the bridge deck. This angle helps viewers understand the model’s shape. A steep overhead view may hide the side supports, while a flat side view may not show enough depth. Choose an angle that makes the main structural features easy to identify.
A useful visual brief can specify brown corrugated cardboard, visible folded edges, a pale table, soft classroom lighting, and a simple background. The model should look small and handmade. Adding a polished steel finish or placing it over a canyon would misrepresent the project. The image should help viewers understand the materials and structure the student actually used.
After generating an initial image, compare it with the reference photograph. Check whether the triangular supports, joints, and connections match the real model. Look for extra triangles, missing parts, and overlapping sections that could not exist in the actual structure. Never present an inaccurate generated image as a construction plan. If the tool cannot reproduce the geometry correctly, use a real photograph of the bridge and limit the generated image to a background or introductory concept.
Image revisions work best when they address a specific problem. For example, dark front supports may make the structure difficult to see. Softer light from the front-left side could make the supports easier to distinguish. If the deck appears too thick, adjust the scale description and compare the result with the reference photograph. Each change should improve an important visual detail.
Pay attention to how the bridge meets the table. A realistic shadow beneath the ends helps show that the model rests on a surface. A support that appears to float can make the image confusing. Use simple lighting and believable contact points instead of dramatic effects. The bridge should remain easy to recognize.
Save useful versions with clear names, such as “clear front supports.” Keep earlier versions so they can be compared. Evaluate each image by asking whether it explains the bridge’s shape more clearly. A professional-looking image is not necessarily the most useful one. Clarity and accuracy matter more than decoration.
Keep measurements outside the illustration
Use the student’s actual notes to prepare the results section. Check every value and unit against the original records. Do not ask an image generator to invent a chart or fill in missing measurements. If the student has not conducted a test, describe the project as a proposal or investigation. Do not present fictional results or claim that the bridge passed a test.
Apply the same care to labels and diagrams. Choose terms the student understands and can explain. Add labels and arrows using a layout or editing tool. Make sure each arrow points to the correct part of the real model. An image generator may help explore the cover composition, but the scientific explanation must rely on real evidence and careful review.
Use a short, clear question as the headline. For example, the question might focus on how the bridge’s shape affects its structure. Avoid broad claims about all bridges or statements that suggest the project proves a major engineering discovery. Keep the display focused on the model and the work the student actually completed. A well-framed question can encourage discussion without overstating the findings.
Prepare images for the board and digital use
A science fair project display may need images in different formats. Plan a wide illustration for the display board and a square version for a class project page. Before generating multiple alternatives, check Seedream 6.0 Pricing and decide how many revisions the project requires. A clear plan can help avoid unnecessary image generation.
For the square version, frame the bridge more closely and remove some of the empty table space. The wider board image can retain more space for the project question and supporting text. Keep the cardboard colour and lighting consistent across both versions. Do not simply crop a finished poster into a square. Small details and text may become difficult to read.
Review each image at its intended display size. On the board, viewers should recognize the bridge from a short distance. On a phone, the triangular supports should remain distinct without zooming in. If the openings merge into a dark area, simplify the background or change the viewing angle. These adjustments improve presentation without changing the student’s actual work or results.
Keep the generated illustration, real photographs, and measured results in separate folders. Give each file a clear name so students and teachers can identify it easily. Include a short note explaining which image is illustrative and which files document the actual model. This distinction helps prevent confusion when others review the project.
If the project page uses alternative text, describe the visible cardboard bridge in simple language. Present the experiment’s findings in accessible text nearby. Do not rely on an image alone to communicate important measurements or conclusions.
A well-designed science fair display helps students explain their work clearly. Real photographs show the model, measurements document the results, and a supporting illustration can introduce the subject. Each element should serve a clear purpose. The final display should reflect the student’s own construction, observations, and reasoning. Good visual design makes that work easier to understand without overstating what the evidence proves.
Science Fair Display Cardboard Bridge: FAQs
1. How do you create a science fair display for a cardboard bridge project?
Use clear photographs of the bridge, explain its design, and present the actual measurements and results.
2. What should a science fair display include?
A science fair display should include the project question, design details, photographs, methods, and actual results.
3. How can visuals improve a science fair display?
Clear visuals help viewers understand the bridge’s structure and follow the student’s design process.
4. Can AI tools help create a science fair display?
Yes, AI tools can create supporting illustrations, but real photographs and measured results should remain the main evidence.
5. How do you make a cardboard bridge project display easier to understand?
Use simple labels, readable text, clear photographs, and a well-organized layout.
Ishika Tawar is a biotechnology researcher and science enthusiast with a curiosity for understanding how life works at the molecular and cellular level. That curiosity started somewhere around school, wandered through a lot of unrelated corners of science and physics, and eventually settled on something she actually wants to spend her life on: aging and longevity. She supports transhumanism and believes that science and technology should be explored seriously as tools to overcome some of the biological limitations of the human body.
Ishika holds a Master's degree in Biotechnology and has experience in both wet-lab and computational research. At ACTREC, she worked on a project studying the interaction of the TG2 protein with the ribosome, where she gained experience in cloning, site-directed mutagenesis, transformation, and gene knockdown. She was also involved in studying ribosomal heterogeneity using R and publicly available single-cell RNA sequencing datasets from different cancers. As a Research Assistant at SafeWright, she worked on client-based projects involving microbial culturing, biochemical tests, and analysis, along with literature research, report writing, and preparation of laboratory protocols. She has also worked with Python-based analysis to study differential DNA methylation in breast cancer.
Her current areas of interest include epigenetics, genomics, gene therapy, stem cell biology, computational biology, and the use of AI in biological research. She is particularly interested in how these areas can contribute to understanding aging and developing ways to extend healthy human lifespan. She has explored this interest through research projects and hackathons focused on AI, aging, and longevity. She enjoys following ideas across biology, technology and physics, and she believes in evidence, questioning ideas and staying curious about things that are not yet understood.
Outside research, Ishika enjoys reading and talking about science and scientific ideas. She loves travelling and is especially fond of mountains. She also enjoys science communication and hopes to make scientific topics easier to understand without making them inaccurate or oversimplified.