Compare eight infrastructure monitoring tools, from open source Netdata to Datadog and Zabbix, and find the one that fits your team.
Top 8 infrastructure monitoring tools in 2026

Estimated reading time: 7 minutes
When a streaming service freezes during a finale or a school portal crashes the night before an assignment is due, someone on the other end is staring at a dashboard and trying to figure out what broke. That work is called infrastructure monitoring: watching servers, networks, and applications so problems get caught before users notice them.
It’s a bigger job than it sounds. A single website can depend on dozens of machines, databases, and network links, and any one of them can fail without warning. Monitoring tools collect numbers from all of those pieces (called metrics), show them on live charts, and send alerts when something looks wrong. The market has plenty of options, and they’re built for very different teams. Below are eight tools worth knowing in 2026, ranked by how quickly they deliver useful answers and how well they fit different kinds of teams.
Infrastructure Monitoring Tools Compared
1. Netdata
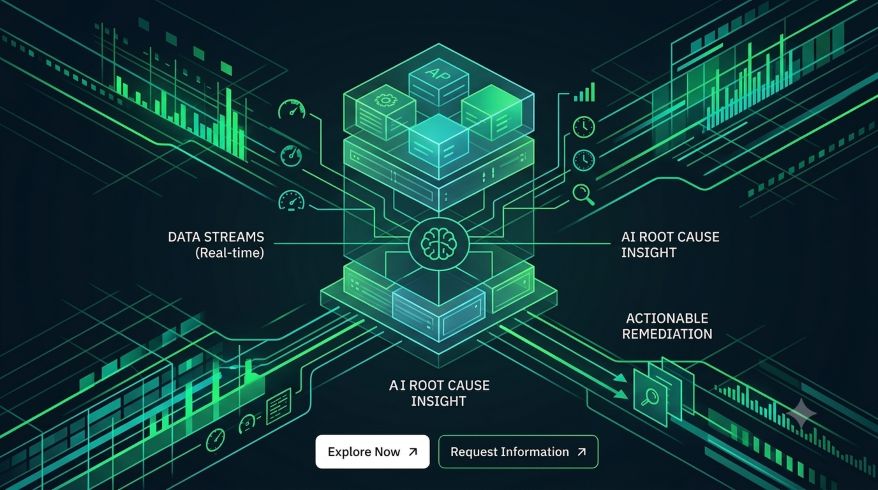
Netdata collects metrics every second and shows them with under two seconds of delay, so you see a problem as it happens rather than a minute later. For teams that want the best infrastructure monitoring tool without weeks of setup, its auto-discovery finds machines, containers, and services on its own, and more than 400 alerts come pre-configured.
Under the hood, Netdata runs 18 machine learning models on each metric to flag unusual behavior, and it connects to more than 800 data sources. The core is open source under the GPL v3 license, with over 76,000 stars on GitHub, according to the company’s site in October 2026. A free tier covers up to five nodes for personal use; paid plans are priced per node.
Best for: teams that want instant, high-resolution visibility with minimal configuration. The trade-off is scope. It’s simpler than a sprawling enterprise suite, which most small and midsize teams count as a plus.
2. Datadog
Datadog is a cloud-based platform that brings metrics, logs, traces, and security data into one place. Its biggest strength is the long list of integrations with cloud services, which makes it easy to see a whole system on a single screen. A student project and a global retailer can both use it, though the experience differs a great deal at each scale.
The catch is cost. Pricing is usage-based, so bills can climb quickly as data volume grows.
Best for: cloud-first companies with a budget and a need for one unified view.
3. Dynatrace
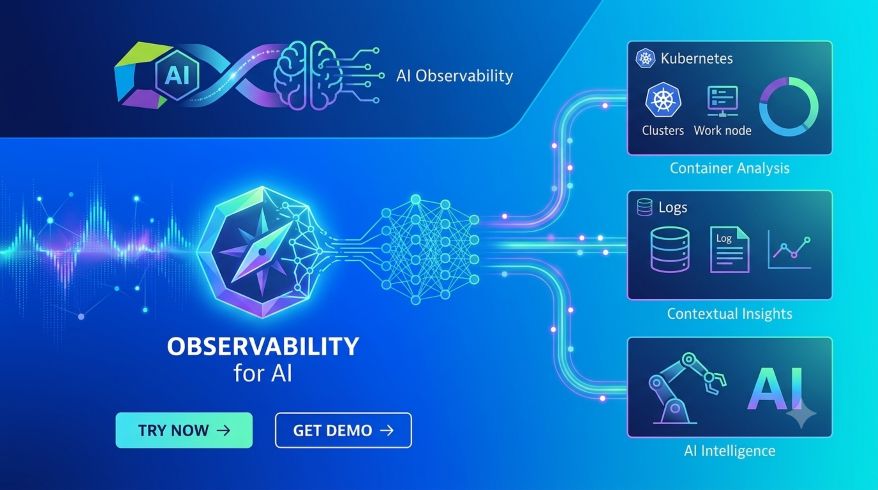
Dynatrace leans on its Davis AI engine to trace a problem back to its root cause, rather than leaving engineers to connect the dots across hundreds of alerts. That helps most in large, tangled environments that mix modern cloud apps with older systems.
It’s a heavyweight product aimed at big organizations, and smaller teams may find it more than they need.
Best for: large enterprises running complex applications.
4. New Relic

New Relic offers full-stack observability, which means it covers servers, applications, and user experience together. Developers like it for application performance monitoring, where it shows exactly which line of code or database query slows a page down.
It also offers a free tier and usage-based pricing, so you can start small and pay as data grows.
Best for: developer-led teams that care most about application performance.
5. Grafana with Prometheus
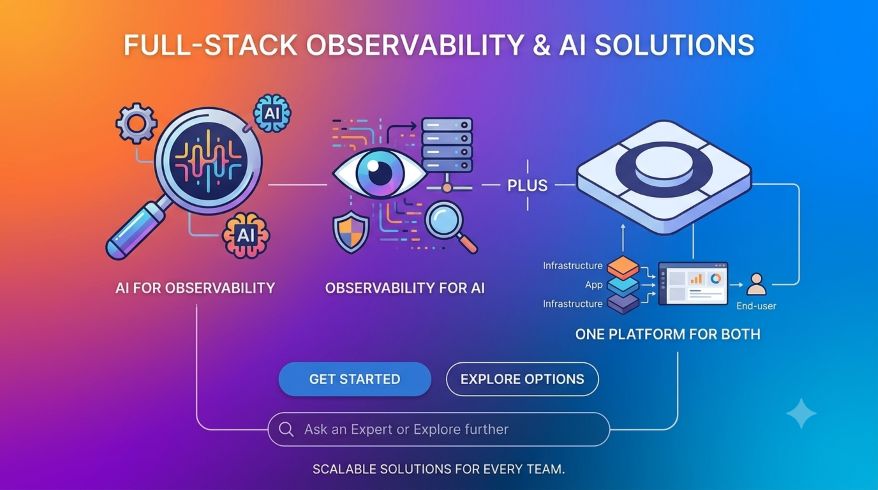
Prometheus collects metrics and Grafana turns them into dashboards. Together they’ve become a standard pairing for monitoring Kubernetes, the system many companies use to run containerized apps. Openness is a big part of the appeal: 77% of respondents in the Grafana Labs 2026 observability survey said open source and open standards matter to their strategy.
The price of that flexibility is assembly. You choose, connect, and maintain each piece yourself.
Best for: engineering teams with the time and skill to build their own stack.
6. Zabbix
Zabbix is a mature open source platform that has been around for years. It’s strong on templates, which let you apply a ready-made monitoring setup to many devices at once, and on SNMP, the protocol most network gear uses to report its status. It scales to very large estates.
Expect a steeper learning curve than newer tools. That matters for physical sites too: hardware sensors in server rooms feed the same kind of temperature data we covered in our look at energy-efficient data center cooling.
Best for: organizations with large, mixed environments and in-house expertise.
7. Checkmk
Checkmk pairs an open source core with automatic discovery of hosts and services, which cuts down on manual setup. It’s popular across Europe and works well in hybrid environments, where some systems sit in a company’s own building and others run in the cloud.
The interface and rule system take some time to learn, though documentation is solid.
Best for: teams that manage a mix of on-premises and cloud systems.
8. PRTG Network Monitor

PRTG, from Paessler, is built around sensors, each one tracking a single measurement such as bandwidth on a switch or the response time of a web page. It’s especially good at watching network devices like routers and switches, and the first setup is quick.
Network problems deserve that attention. The Uptime Institute’s Annual Outage Analysis 2026 found that network issues account for the largest share of IT service outages, driven by configuration and change management failures. The downside is cost: because licensing counts sensors, bills rise as you monitor more.
Best for: IT teams focused on network health, typically on Windows.
What to look for when choosing an infrastructure monitoring tool
Before comparing names, decide what matters most to you. Five questions usually settle it.
- How long does setup take? Some tools work within minutes; others need days of configuration.
- How detailed is the data? A tool that records every second catches brief spikes that a once-a-minute check misses entirely.
- How good are the alerts? Too many false alarms and people start ignoring them.
- Is it open source or software as a service (SaaS)? Open source code is free to inspect and change, while SaaS means the vendor runs it for you.
- What does it cost as you grow? Pricing by server, by data volume, or by sensor behaves very differently at scale.
Complexity is the most common complaint. In its 2026 observability survey, Grafana Labs found that 38% of respondents named complexity and overhead as their biggest concern. A tool you can’t operate comfortably is a tool that won’t catch the outage. Simplicity isn’t a luxury here; it’s what keeps the dashboard useful at 3 a.m. when something breaks and the person on call is half asleep.
Infrastructure Monitoring Tools: Picking the right fit
There’s no single winner for everyone. A small team with a handful of servers needs quick setup as well as clear charts; a global company needs integrations and governance. Match the tool to your team size and stack, then test it. Nearly every tool above offers a free tier or a trial, so run two of them side by side for a couple of weeks before committing.
Whatever you choose, treat monitoring as an ongoing habit rather than a one-time install. The U.S. National Institute of Standards and Technology describes continuous monitoring as maintaining ongoing awareness so organizations can make informed risk decisions. Good monitoring also supports recovery; as we explained in our guide to AI-enabled cyber recovery planning, you can’t restore what you can’t see.
Reviewed by Satish Kulkarni on October 16, 2026
Note: The article includes external links to third-party services; readers should independently evaluate any referenced platforms before engaging.
- Author
- Latest Posts

Sneha More is an Information Technology specialist, data analyst, and technology writer with a strong focus on data science, big data frameworks, and modern web technologies. Guided by a philosophy of continuous, hands-on learning, she explores how distributed systems and analytical models can be leveraged to extract meaningful insights from massive datasets.
With practical experience in data analytics, dataset manipulation, and statistical modeling, Sneha examines the intersection of machine learning, big data infrastructure, and practical software engineering. She is particularly interested in how emerging data architectures can drive informed decision-making and solve real-world technical challenges.