First, plants play a vital role in the Earth’s carbon cycle. They absorb carbon dioxide from the atmosphere, store carbon in their tissues and soils, and, as a result, help regulate the climate. However, climate…
Carbon Response Atlas: Exploring Carbon Cycling Across Ecosystems
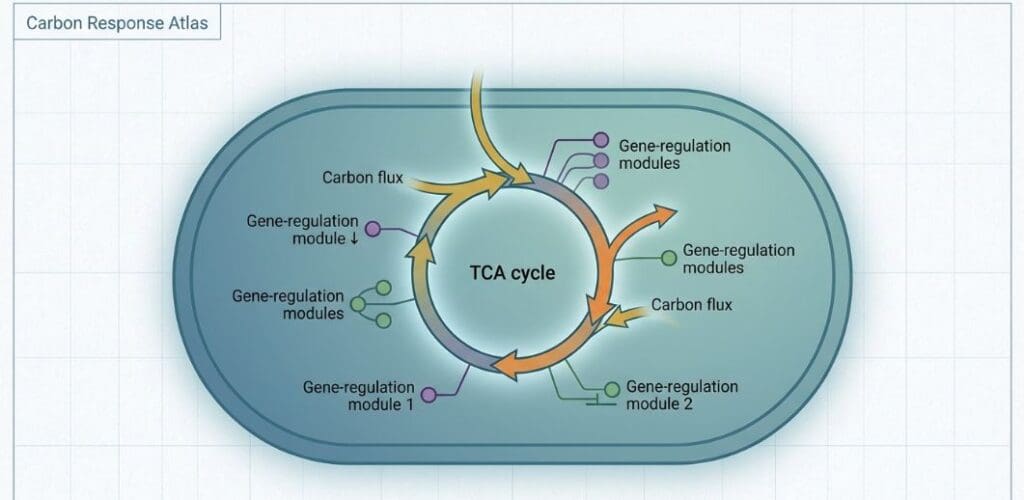
First, plants play a vital role in the Earth’s carbon cycle. They absorb carbon dioxide from the atmosphere, store carbon in their tissues and soils, and, as a result, help regulate the climate. However, climate change is placing increasing pressure on plants and ecosystems. Therefore, scientists need better ways to understand how plants respond to changing carbon levels. To address this need, researchers have developed a powerful tool known as the Carbon Response Atlas.
Key Takeaways: Carbon Response Atlas
- The carbon response atlas tracks plant carbon uptake across global biomes using satellite and sensor data.
- It helps scientists predict how forests, grasslands, and crops will respond to elevated atmospheric carbon.
- The atlas supports climate policy by identifying regions where carbon storage is most vulnerable.
- Educators can use atlas data to teach ecosystem dynamics and climate science.
- Open-access data from this atlas enables researchers worldwide to study plant-climate interactions.
Understanding the Carbon Response Atlas
First, the Carbon Response Atlas is a detailed dataset that shows how plants change their growth and metabolism when carbon dioxide (CO₂) levels change. Next, botanists refer to this response as the carbon fertilisation effect. For example, when CO₂ levels increase, many plants can increase their rate of photosynthesis. In addition, plants may change how they use and distribute carbon among their roots, stems, and leaves.
The Science Behind Plant Carbon Uptake
First, plants take in carbon dioxide (CO₂) through tiny openings on their leaves called stomata. Next, they use sunlight to change CO₂ and water into sugars through a process known as photosynthesis. When CO₂ levels increase, plants may not need to keep their stomata open as much. As a result, they can lose less water while still taking in more carbon dioxide. Therefore, higher CO₂ levels may seem helpful for plant growth and water use.
Key Components of the Carbon Response Atlas
The Carbon Response Atlas contains three main layers of information. First, it provides global maps of net primary productivity, which shows how much carbon plants capture and store through growth each year. Second, the atlas includes data on soil carbon storage. Importantly, soils store large amounts of carbon and can hold more carbon than all living plants combined. Therefore, understanding soil carbon is important when studying the global carbon cycle.
How Scientists Construct the Atlas
Building a Carbon Response Atlas requires teamwork across many different fields. First, ecologists collect data directly from plants, soils, and natural areas. Next, remote sensing experts study and process images from satellites to observe changes across large regions. Furthermore, climate scientists use these data to build models and explore possible future climate conditions. In addition, statisticians check the data carefully to make sure it is accurate, reliable, and easy to compare.
| Data Component | Source Type | Coverage |
|---|---|---|
| Net primary productivity | Satellite (MODIS) | Global, 1 km resolution |
| Soil carbon content | Field surveys | 15,000+ soil profiles |
| CO2 enrichment experiments | FACE facilities | 50 long-term sites |
| Climate variables | Weather stations | 30-year records |
Applications in Climate Science and Policy
The Carbon Response Atlas has several practical uses. First, climate models need accurate information about the carbon cycle to make reliable estimates. Therefore, the atlas can provide useful data that may help improve these predictions. Furthermore, better climate predictions can support more informed climate planning and policy development. For example, the atlas can show how different ecosystems may change as climate conditions shift. In addition, some boreal forests may lose their ability to store carbon effectively under certain conditions. For instance, wildfires and insect outbreaks can damage forests and reduce the amount of carbon they store. As a result, some affected boreal forests may release more carbon than they absorb.
Limitations and Future Directions
No scientific tool is perfect. Therefore, the Carbon Response Atlas also has some limitations. First, its spatial resolution may not show small differences within an area. For example, small patches of different types of plants may be grouped together and treated as one area. As a result, some local changes may not appear clearly in the data. Second, the atlas may have difficulty predicting how plants respond to sudden and extreme events. For instance, heatwaves and floods can develop quickly and cause major changes in plants and ecosystems. However, models based mainly on average climate conditions may not fully capture these sudden events. In addition, plant responses can vary from one place to another and can change as environmental conditions change. Consequently, atlas-based predictions should be used along with other field data and observations.
Practical Uses for Educators and Communicators
Science communicators can use the atlas to explain complex concepts. Show students how carbon moves through ecosystems. Use the atlas to demonstrate regional differences in climate impacts. For example, compare carbon storage in temperate forests versus grasslands.
Teachers can create interactive lessons using atlas data. Ask students to explore different regions. Have them predict how climate change might alter carbon storage. This hands-on approach makes abstract ideas concrete. The atlas also supports interdisciplinary learning. It connects biology, climate science, geography, and data analysis.
Frequently Asked Questions: Carbon Response Atlas
What is a carbon-response atlas transcriptional state?
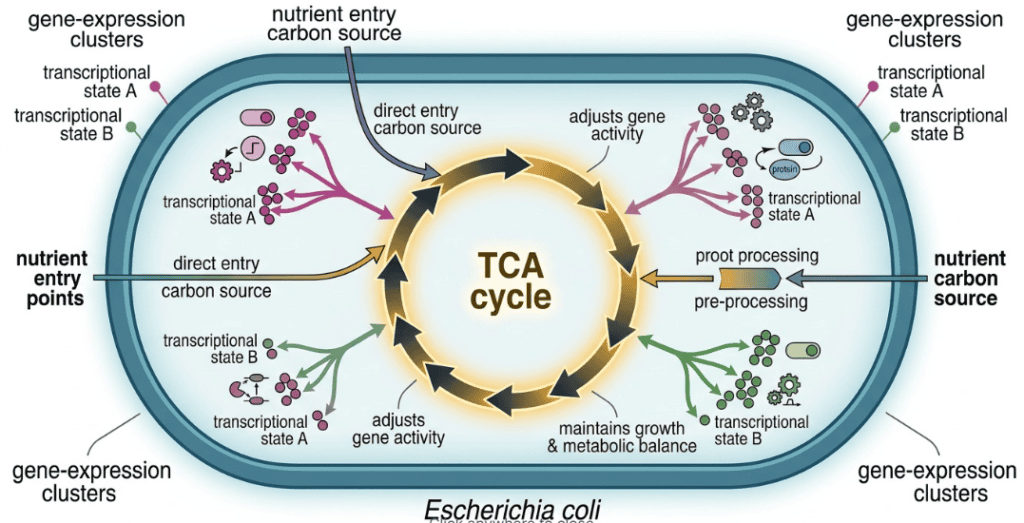
A carbon-response atlas transcriptional state is the way E. coli changes its genes when it uses a certain food source. Different foods can switch different genes on or off. These gene changes help the cell use food, make energy, and stay alive.
What types of carbon sources were studied?
The study looked at many food sources, such as sugars, amino acids, and organic acids. Each food source caused a different set of genes to turn on or off. These gene changes helped E. coli use the food and make energy.
What role does the TCA cycle play?
The TCA cycle helps the cell make energy from food. The study showed that where a food nutrient enters the TCA cycle can change which genes become active. These gene changes can affect how the cell works, grows, and uses energy.
Reference
Shin, J., Patel, A., Lou, X. A., Catoiu, E. A., Krishnan, J., Hefner, Y., Szubin, R., Sung, J., Son, H. F., Zielinski, D. C., & Palsson, B. Ø. (2026). A systems-level atlas of carbon-response transcriptional states in Escherichia coli. Proceedings of the National Academy of Sciences, 123(27), e2531884123. https://doi.org/10.1073/pnas.2531884123
- Author
- Latest Posts

I completed my Master of Science from the University of Allahabad in 2017 with a strong academic background in life sciences and chemistry. My specialization included Molecular Biology, Microbiology, Genetics, Plant Breeding, Phycology, Paleobotany, and Bioinformatics, along with Organic Chemistry, Inorganic Chemistry, and Physical Chemistry. This multidisciplinary training provided me with a comprehensive understanding of biological systems and analytical scientific approaches.
After completing my postgraduate studies, I gained valuable professional experience in both the education and social development sectors. I worked at A.M. Oxford Public School, where I was actively involved in guiding students toward academic excellence. In this role, I focused on creating an engaging learning environment, encouraging critical thinking, and nurturing students’ curiosity for scientific learning. My experience as an educator strengthened my communication, mentoring, and classroom management skills.
In addition to my teaching experience, I worked with Jeevan Jagriti Foundation, where I contributed to community-based initiatives aimed at improving educational access and awareness among underprivileged sections of society. Through this work, I participated in programs designed to support social development and promote the value of education in marginalized communities.
These professional experiences helped me develop strong interpersonal, leadership, and organizational skills while reinforcing my commitment to education and community service.